Density of States (DOS)
Do you want to get all tutorial materials on your local machine?
You can get all files and set up your local environment. Do that now before proceeding.
In the band-structure tutorial we showed how the allowed energy levels (bands) of electrons in a crystal vary with momentum (the k-points in the Brillouin zone).
A density of states (DOS) plot, on the other hand, shows how many electronic states are available at each energy level, regardless of momentum. It is obtained by summing over all k-points for each energy. The DOS plot provides a direct measure of the number of states that electrons can occupy at each energy, which is useful for understanding electronic, optical, and thermal properties of materials.
The features of the DOS (such as peaks and gaps) correspond to the distribution and spacing of bands seen in the band-structure plot.
Formally, as seen in the theoretical background, the DOS can be computed as:
Computing the DOS
Hint
Enter the MgO directory
We will analyze the density of states for the MgO crystal considered in the band-structure tutorial.
To plot the DOS you will use the utility program Eig2DOS.
This program reads the file MgO.EIG (always
produced by SIESTA), which contains all the eigenvalues for each k-point used
to sample the BZ, and the file MgO.KP, which contains the k-point
sampling information.
Useful options to the program (type Eig2DOS -h for a full list)
are: the broadening for each state (e.g. the width of a gaussian that
approximates the delta-function in the above equation) in eV (default
0.2 eV), the number of energy points where the DOS will be calculated
(200 by default), and the minimum and maximum values of the energy range considereded.
For example:
Eig2DOS -h # for options
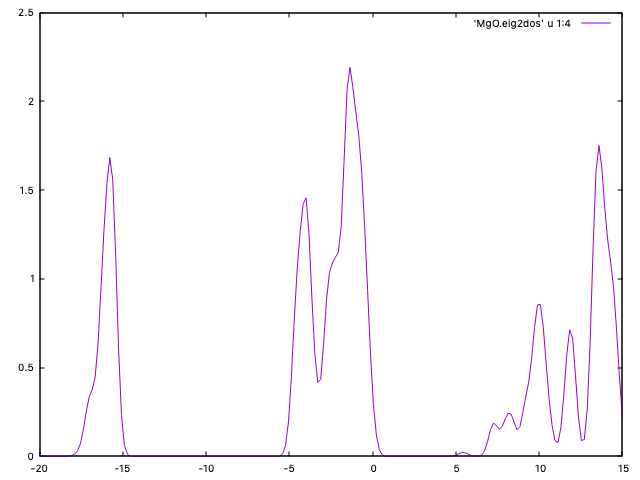
Eig2DOS -f -e -20 -E 15 -s 0.4 -k MgO.KP MgO.EIG >| MgO.dos
will compute the DOS in the range of energies [-20,15] (eV), with the
Fermi level shifted to zero, using a grid of 200 points, a broadening
(“smearing”) of 0.4 eV, and using the k-point info from MgO.KP.
Plot the dos using gnuplot:
plot "MgO.dos" with lines
Note
CHECK: If you want to save your plots as png images, sample GNUplot scripts
are provided in the PlotScripts directory.
Hint
Compare the DOS plot to the band-structure plot and notice the correspondence between features. In particular, identify the split first band and the band gap (which appears narrower in the DOS plot due to the smearing applied).